
How to analyze several greenhouse crop cycles with the records you already have
Reviewed: · SeedMatchGroup
Short answer
Put at least two or three comparable cycles of the same crop side by side, convert every input to the same unit (per m² and per kg of marketable produce), and look for the line that moves most between your best and worst cycle. That line — not the average — usually points to the bottleneck worth investigating first.
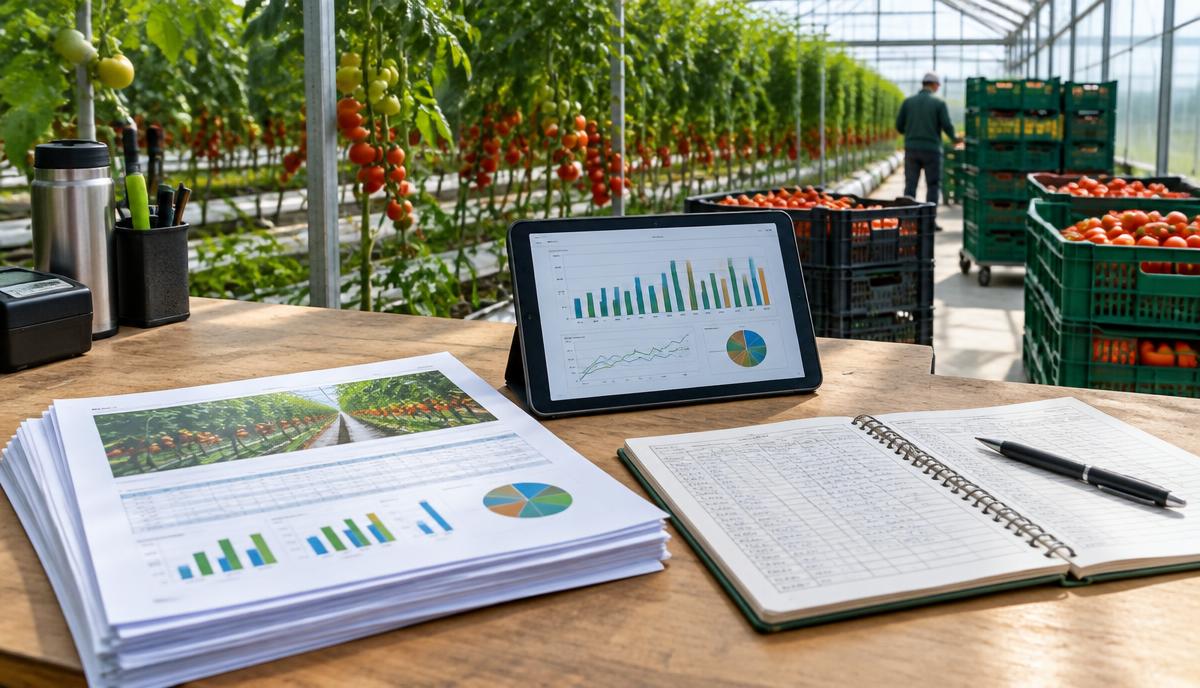
Long-running growers often have more evidence than they think: harvest sheets, packhouse grading reports, water-meter readings, fertilizer invoices, energy bills, payroll and maintenance logs. This guide shows how to turn them into one comparison table, what to do when some records are missing, and how to read the result without jumping to conclusions.
What counts as a comparable cycle
A cycle is comparable when the crop, variety type, planting window and growing area are similar enough that a difference in results can be explained by management, equipment or weather rather than by a different product.
- Same crop and similar variety segment (for example, cluster tomato vs. cluster tomato).
- Similar planting and harvest window, or a clear note of the season.
- Same production area, or results converted to per-m².
- Known changes recorded: new substrate, new controller, staff change, disease outbreak.
If your cycles are not comparable, compare each one with itself (input per kg sold) rather than with each other.
The data you need — and where to find it
| Indicator | Typical source | Unit to use |
|---|---|---|
| Marketable yield | Packhouse or sales records | kg/m² per cycle |
| Grade-out / rejects | Grading reports, returns | % of harvested kg |
| Water applied | Water meter, irrigation controller logs | L/m² and L/kg marketable |
| Drain volume (if substrate) | Drain meter or manual measurement | % of applied |
| Fertilizer | Invoices, stock-book | cost or kg N/K per m² |
| Energy | Utility bills, fuel delivery notes | kWh or fuel per m² and per kg |
| Labour | Payroll, time sheets | hours per m² and per 1,000 kg |
| Failures and downtime | Maintenance log | events and hours per cycle |
Keep the original documents; record in the table only what you can trace back to them.
Step-by-step: build the comparison table
- List the cycles in columns (for example, Spring 2024, Spring 2025, Spring 2026).
- Fill each row from the table above, with the source document noted.
- Normalize: divide by area (m²) and by marketable kg.
- Mark gaps as "missing" — never fill them with a guess.
- Calculate the spread for each row: (best − worst) ÷ average.
- Rank the rows by spread and by money impact.
- Write one hypothesis for the top two rows, and the evidence that would confirm or reject it.
Greenhouse performance audit template (copy into your spreadsheet)
One row per block, crop and season. Fill only what your records support; leave the rest blank and note why.
| Field | Formula / unit | Typical record |
|---|---|---|
| Crop, variety, planting–last harvest dates | text, dates | crop plan |
| Productive area | m² | site plan |
| Marketable yield | marketable kg ÷ m² | packhouse / sales |
| Grade-out | rejected kg ÷ harvested kg × 100 | grading sheets |
| Water intensity | litres applied ÷ marketable kg | meter, controller |
| Fertilizer intensity | kg product (or kg N) ÷ marketable kg | invoices, stock |
| Energy intensity | kWh or fuel units ÷ marketable kg | bills, sub-meters |
| Labour intensity | hours ÷ tonne marketable | time sheets |
| Downtime / failures | events, hours | maintenance log |
Reading the audit: compare the same crop and season across years first. A line that is much worse than your own best comparable cycle is a candidate bottleneck — then check with the diagnosis steps above.
Limitations: intensities differ by crop, variety, cycle length, climate, heating season and market grade, so do not compare against other farms' or published figures without matching those conditions. Shared meters must be split with a stated assumption.
A hypothetical worked example
Hypothetical numbers, for method only — not benchmarks for any crop or region.
| Row | Cycle A | Cycle B | Cycle C |
|---|---|---|---|
| Marketable yield (kg/m²) | 30 | 34 | 26 |
| Rejects (%) | 8 | 6 | 15 |
| Water (L per kg marketable) | 28 | 25 | 35 |
| Labour (h per 1,000 kg) | 40 | 36 | 48 |
Cycle C is worst on every row and its rejects almost double. A sensible next question is why rejects rose (a disease event, a heat period, a fertigation fault, a grading change) before assuming more area or new equipment is the answer.
Separating process, equipment and management problems
- Process: the method is wrong or inconsistent (irrigation timing, pruning, harvest interval). Clue: results vary by shift, block or worker.
- Equipment: the system cannot deliver what is set (vents that do not open, uneven drippers, a faulty sensor). Clue: logs show setpoints not reached, or measured uniformity is poor.
- Management: decisions or planning are late (ordering, staffing, maintenance). Clue: problems follow delays, not weather or hardware.
A single bad cycle can mix all three. Record which one each piece of evidence points to.
What to do when data is missing
- Use partial periods: one well-recorded month is better than a full season of estimates.
- Use proxies with a clear label: pump run-hours × rated flow for water, delivery notes for fuel.
- Start measuring now on one block: a water meter, a drain cup, a simple harvest-per-row sheet.
- State what you do not know in any RFQ, so suppliers do not design around invented numbers.
When to bring in an adviser or lab
Ask a local extension service, agronomist or accredited lab when the comparison points to water quality, nutrient balance, root-zone disease or pest pressure. Irrigation-water tests (pH, EC, alkalinity, specific ions) are interpreted against crop and system — Penn State Extension's guidance is a useful starting point, but local specialists and regulations govern.
Your historic reports are a baseline, not a verdict. Build the comparison table, mark what is missing, test the top hypothesis on a small area, and only then decide whether you need an upgrade, an expansion or a process change.
Tools and next steps
Frequently asked questions
- How many cycles do I need?
- Two comparable cycles show a difference; three or more help you see whether it repeats. If you have only one, use it as the baseline and start measuring the next one carefully.
- Should I compare with published yields?
- Only with care. Published figures depend on crop, variety, climate, technology and period. Your own best cycle is usually a more honest reference.
- What is the most useful single indicator?
- Marketable kg per m² together with rejects. Total harvest hides grading losses that often explain the gap between cycles.
- Can software do this for me?
- Software helps once the records are consistent. The first comparison is usually faster in a spreadsheet built from your documents.
- Does this guarantee better results?
- No. It helps you choose what to investigate. Results depend on crop, variety, climate, water, market and how changes are carried out.
Sources
- Penn State Extension — Greenhouse Production
- Penn State Extension — Interpreting Irrigation Water Tests
- Penn State Extension — Is Irrigation Water Quality Causing Yield Reductions?
- FAO Irrigation and Drainage Paper 56 — Crop Evapotranspiration (Allen et al., 1998)
General planning guidance. Results depend on crop, variety, climate, water, regulation and market; numerical examples are hypothetical. Confirm decisions with qualified local specialists.
Related guides in this series
- Expand Greenhouse Area or Upgrade First? A Data-Led Test
- Greenhouse Expansion Planning: Demand, Water, Energy, CAPEX
- Commercial Greenhouse Design Basis: Climate, Crop, Water, Budget
- Precision Fertigation: ETc, Drain EC and Distribution Uniformity
- Greenhouse Trial Design: Baseline, KPIs and Sensor Calibration
- Greenhouse Investment Plan: CAPEX, OPEX, ROI Scenarios, RFQ
- Greenhouse Retrofit in Phases: Controls, Cooling, Fertigation
- Greenhouse Yield and Quality: Irrigation, EC, Climate Data
- Choosing Greenhouse Vegetable Varieties: HR/IR, Cycle, Market