
Precision irrigation and fertigation: calculating water and nutrient needs, monitoring salinity, uniformity and efficiency
Reviewed: · SeedMatchGroup
Short answer
Estimate daily crop water need as ETc = Kc × ETo, divide by system efficiency to get the gross amount, check that emitters deliver it evenly with a uniformity test, and monitor supply and drain EC to manage salinity. Nutrient concentrations come from a crop-, stage- and water-specific recipe prepared with your adviser.
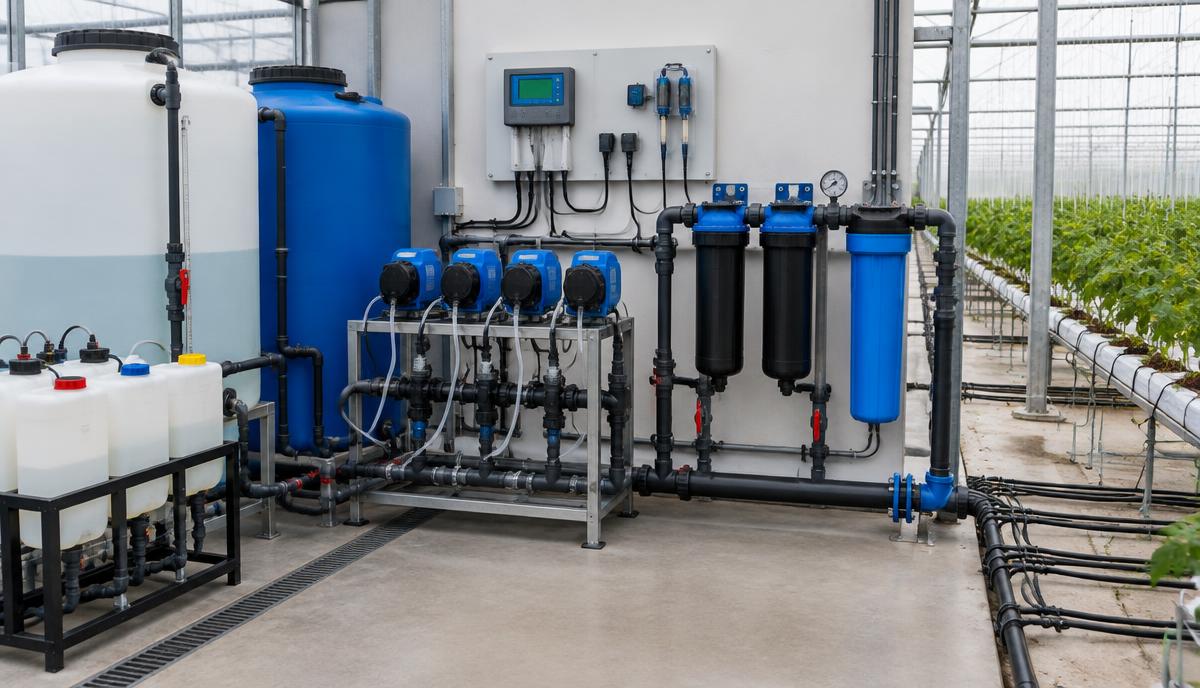
Precision does not start with new hardware; it starts with knowing how much water the crop needs, how evenly the system delivers it and what happens to salts in the root zone. This guide gives the core calculations, a uniformity test and a monitoring routine.
Water need: the FAO-56 method
- ETo (reference evapotranspiration, mm/day) from a local weather station or calculation.
- Kc (crop coefficient) for the crop and growth stage, from FAO-56 tables or local research.
- ETc = Kc × ETo (mm/day). 1 mm over 1 m² = 1 litre.
- Gross requirement = ETc ÷ application efficiency, plus any planned leaching or drain.
Inside greenhouses, ETo differs from outside conditions; use measurements or local guidance where available. The irrigation water and flow calculator applies these steps.
Hypothetical worked example
Hypothetical inputs to show the arithmetic.
ETo 5 mm/day, Kc 1.0 → ETc 5 mm/day. Efficiency 90% → 5.6 mm/day gross. On 10,000 m²: about 56 m³/day. Over 8 irrigation hours: about 7 m³/h of pump capacity, before drain or leaching. Replace every input with your own data.
Uniformity test
- Place catch cups (or measure emitter flow) at evenly spread points across a block — near the start, middle and end of laterals.
- Run one irrigation event and measure each volume.
- Distribution uniformity (low quarter) = average of the lowest 25% ÷ overall average.
- Low values point to clogging, pressure differences or damaged emitters. Fix before changing irrigation amounts.
Salinity and EC monitoring
| Measure | Frequency | Why |
|---|---|---|
| Source water EC, pH | Each new source, and periodically | Baseline salt load |
| Supply (dripper) EC, pH | Daily | Checks dosing accuracy |
| Drain EC, pH and volume (substrate) | Daily or several times a week | Shows salt build-up and uptake |
| Lab analysis of water and drain | Seasonally or when trends change | Specific ions (Na, Cl, B, etc.) |
Interpret trends with your adviser for crop, substrate and water. Penn State Extension's guidance on irrigation water tests explains common parameters; limits are crop- and system-specific.
Nutrients: no universal recipe
Recipes depend on crop, variety, stage, substrate or soil, source-water composition and climate. Get them from your agronomist or supplier, check the dosing unit against a hand meter, and record every recipe change with the date.
Efficiency indicators to track
- Litres applied per kg marketable produce
- Drain percentage over time (substrate)
- Pump energy per m³
- Fertilizer used per kg marketable produce
Compare these against your own previous cycles, not against generic figures.
Calculate need, verify uniformity, watch EC in supply and drain, and track litres per marketable kg. That loop is the core of precision irrigation and fertigation.
Tools and next steps
Frequently asked questions
- Where do I get Kc values?
- FAO-56 lists typical values by crop and stage; local research or your adviser may give better values for greenhouse conditions.
- What drain percentage should I aim for?
- It depends on crop, substrate, water quality and climate. Set it with your adviser and adjust from drain EC trends.
- How often should I test uniformity?
- At commissioning, at least each season, and whenever growth looks uneven.
- Can automation replace monitoring?
- Automation applies decisions consistently; sensors still need calibration and people still need to review trends.
- Will precision irrigation guarantee water savings?
- No. It helps you measure and reduce waste; results depend on crop, climate, system and management.
Sources
- FAO Irrigation and Drainage Paper 56 — Crop Evapotranspiration (Allen et al., 1998)
- Penn State Extension — Interpreting Irrigation Water Tests
- Penn State Extension — Is Irrigation Water Quality Causing Yield Reductions?
General planning guidance. Results depend on crop, variety, climate, water, regulation and market; numerical examples are hypothetical. Confirm decisions with qualified local specialists.
Related guides in this series
- Expand Greenhouse Area or Upgrade First? A Data-Led Test
- Greenhouse Expansion Planning: Demand, Water, Energy, CAPEX
- Commercial Greenhouse Design Basis: Climate, Crop, Water, Budget
- Greenhouse Trial Design: Baseline, KPIs and Sensor Calibration
- Greenhouse Investment Plan: CAPEX, OPEX, ROI Scenarios, RFQ
- Greenhouse Crop Cycle Analysis: Yield per m², Inputs, Rejects
- Greenhouse Retrofit in Phases: Controls, Cooling, Fertigation
- Greenhouse Yield and Quality: Irrigation, EC, Climate Data
- Choosing Greenhouse Vegetable Varieties: HR/IR, Cycle, Market